Baseline Court Statistics Dataset

Published
May 4, 2023
This blog post gives an overview of LSC’s Baseline Court Statistics (BCS) dataset, which is publicly available in Box here.
The COVID-19 pandemic brought new attention to how public health crises can deeply impact low-income Americans in civil court. Massive job loss led to Federal stimulus packages to stave off widespread eviction. Meanwhile, there is continued discussion of how Americans took on more credit card debt to pay for essential goods during the pandemic, which might inspire widespread debt collection in the near future, further sinking low-income Americans into poverty.
While the full extent of these changes will be unclear for some time, they will surely have a lasting impact on many Americans lives for years to come. Data from civil courts can help illustrate how issues, such as eviction, debt, and domestic violence have changed during the pandemic. Beyond the pandemic, having readily-available civil court statistics is useful in tracking how Federal, state, and local policies and programs impact how the courts are used in litigation.
Unfortunately, there is no single comprehensive dataset of civil court statistics in the U.S. Many courts release annual statistical reports describing case activity in their jurisdiction. These reports often include the number of cases filed and disposed in each county or local court broken down by case type. When combined across jurisdictions, these statistics can form a baseline for researchers and the media to understand case trends and compare rates across counties.
Filling a Gap
Numerous initiatives have contributed data on national civil case statistics to give the public greater insight into how courts manage and process civil cases. The National Center for State Courts (NCSC) and the Conference of State Court Administrators (COSCA) publish caseload statistics as part of the Court Statistics Project (CSP). State courts submit data to CSP that conform to rigorous definitions and case counting rules to allow for greater comparability across states. The civil data collected distinguishes between numerous civil case types, including small claims, contract, and probate/estate. Unfortunately, the data is only available at the state-level; users are unable to analyze variations between cities or counties.
Princeton’s Eviction Lab has built a national database of eviction filings. Researchers use this database to highlight the prevalence and nature of eviction. This database has served as the foundation for cities and states to measure the impact of their programs and policies to alleviate the disparate impacts of eviction. To fill gaps where court records were unavailable, Princeton collected data from annual reports issued by the courts. Their work highlights how aggregate data in annual court reports can illustrate trends that occur at the city and county-level.
Building on lessons learned from these initiatives, LSC identified a need to create a dataset of county-level civil filing counts that spans multiple civil case types. This dataset will serve as LSC’s primary means for validating the data it collects from state court systems to assess accuracy. We also see value in making the data available for researchers, the media, and the public to investigate how frequent various civil legal issues are in their communities.
How We Collected Data
State courts release aggregate statistics in numerous ways, including annual reports, spreadsheets, and dashboards. We compiled civil filing counts from these sources and supplemented the data with formal data requests in states where filing statistics are not publicly released.
Some states only release these statistics as tables in PDF reports without making the data available as standalone spreadsheets. PDFs often require additional processing to accurately extract tables so we requested spreadsheets in many cases. Many courts provided spreadsheets to LSC, either for free or for a nominal cost. Where we were unsuccessful in receiving spreadsheets, we used Adobe Acrobat Pro and Tabula to extract the tables from PDFs. In a small number of instances, we manually copied information from PDF reports into a spreadsheet because the reports could not be parsed by extraction software. Manual extraction was a last resort because manual processing adds another source of potential error.
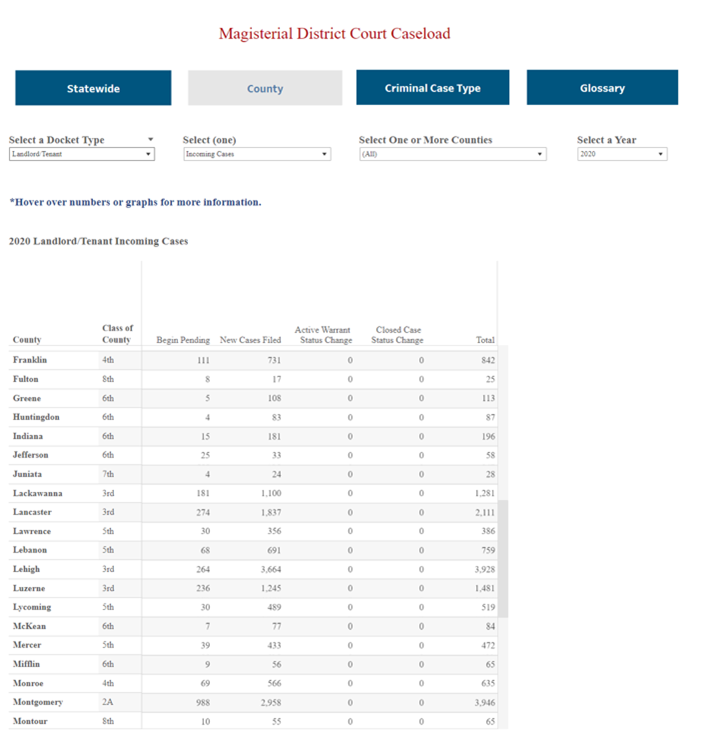
Multiple states release data in dashboards to provide users with a more accessible means for exploring the data and visualizing trends. Some of these dashboards were created during the pandemic specifically to release timely eviction statistics. We developed software and leveraged existing open-source options to scrape data from these dashboards.
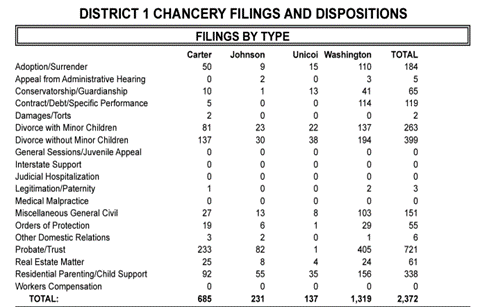
Screenshots of State Court Dashboards and Reports including civil filing information.


Many states have multitiered court systems where one or more lower courts will handle certain legal matters which might then be appealed to a higher court. We have specifically focused on courts of original jurisdiction for matters that impact low-income Americans, namely eviction and debt collection. For this reason, not all courts in all jurisdictions are represented in the BCS dataset. Appellate courts and lower courts with more narrow scopes (i.e., chancery, probate) are underrepresented or missing in our data because we did not specifically investigate them; however, in jurisdictions where statistics for these other courts are released alongside the primary courts of interest, we have compiled and released that data.
We strove to retain the original structure of the tables during the initial extraction. This meant preserving the column and row structures so we could more easily inspect any differences between the original tables and our extracted data. After this extraction, we loaded the data into our database and converted the data into the common structure you see in the resulting dataset. Whereas the original tables might have included columns for each case type or county, we have transformed these columns into rows. This data format allows us to easily integrate any new dataset into a common structure; we hope this structure will make the data more accessible for users.
Limitations
The BCS dataset is an amalgamation of datasets made available by state courts. Each of these state courts might count filings slightly differently which might result in incomparable numbers in the BCS dataset. The NCSC CSP remains the dataset with the greatest comparability across states because they have rigorous reporting standards for the data they receive from state courts.
Furthermore, state courts often have different financial or statutory authorities that influence the types of cases they hear. For instance, small claims cases in Arizona include legal actions with a monetary value up to $3,500; cases with higher values would be classified as a different legal matter. Meanwhile, Tennessee has a $25,000 limit for small claims cases. These differences would influence the number of small claims cases in these states; states with higher limits might witness larger numbers of small claims cases because more cases fall under those limits.
Not all state courts are required to report filing counts to the state court. In Mississippi, the Justice Courts are not a court of record and limited information about eviction and debt cases in these courts are recorded. Furthermore, Justice Courts are only required to report criminal case counts to the state courts. Therefore, the BCS dataset is missing filing counts from these lower courts. This limitation will restrict the availability of statistics from courts that are not courts of record in numerous states.
These limitations should be taken into account when interpreting the filing counts and rates in the BCS dataset.
How We Use the Data
LSC has been collecting civil court records from state courts since 2019. We primarily scrape court records from public websites where users can search for individual cases to see details, such as the parties, hearing, and judgment information.
While this data is collected from public sources and are generally regarded as reliable, there are numerous limitations that might result in fewer civil records being scraped than actually exist. If a jurisdiction automatically seals some eviction cases, the number of eviction cases scraped from a public website might differ significantly from the number reported in the court’s annual report. Courts have also migrated from physical to digital records over the past two decades. In some jurisdictions, older cases might not have been fully migrated and made available online. This practice might mean that historical analysis is limited in these jurisdictions for cases filed in the 2000s. Furthermore, when scraping any website, the possibility of potential algorithmic errors always exists. Such errors may randomly or systematically exclude certain cases from being collected.
To investigate these potential issues, we use annual court statistics to help verify the scraped data. The BCS dataset will serve as our verification dataset as we collect more civil court records. In each new jurisdiction, we compare the number of filings between our scraped data and the BCS dataset at the year, county, and case type-level. For instance, if we compare the number of landlord-tenant cases filed in Allegheny County, PA in 2020 from our scraped data to the number of cases reported in the BCS dataset, we can say that we have collected 99.89% of the landlord-tenant cases filed in Allegheny County, PA in 2020. In Connecticut, we found inconsistent eviction filing counts before 2017. Further investigation revealed that the Connecticut state housing courts instituted a single statewide database in 2017 that improved the accuracy of the data. We will not use eviction filing data before 2017 in Connecticut based on this finding. This type of comparison serves as a starting point for us to check our data collection methods and to discuss anomalies with local courts and legal aid providers to attempt to reconcile the differences. We generally will not use data where we do not have 80% of the annual filings in a given county for a given case type.
Drawing conclusions from any dataset that has not been verified might produce estimates that differ significantly from reality. That is why we are releasing this data so others might improve their data collection using the same dataset that we do.
Future Work
We are releasing this dataset now to maximize its utility for others; however, we plan to make enhancements to improve its value. Primarily, we plan to standardize the case types to conform to NCSC National Open Court Data Standards (NODS) to improve the comparability across jurisdictions. Beyond filing counts, these annual reports often include additional important statistics describing how cases proceed that would benefit researchers. Many states provide judgment counts and some even provide detailed breakdowns of how cases were resolved (i.e., default, dismissed, for plaintiff). We will extract this information from the reports and make these datasets available in time.
Recommendations
As previously mentioned, many state courts release annual filing counts in PDF documents or dashboards. Many of the PDF documents we encountered contained tables, however we could not easily extract the data like we would with a spreadsheet. We were forced to use table extraction methods to retrieve the data. These additional methods increase our processing time and introduce additional potential error. Courts might release these same tables in Excel format to support researchers seeking to use this aggregate data to improve access to justice.
A smaller number of courts release the data in accessible formats that facilitate analysis, such as Excel or CSV format. Tableau is the most common dashboard tool used in releasing these statistics, however, few of these dashboards allow users to download the data as a spreadsheet. These dashboards could be enhanced by enabling this feature so users could analyze the data in ways that the dashboard does not allow.

